Ruth Mott Foundation Logo
  • About Us
      • About Us
      • Our Founder & Mission
      • About Applewood
      • Board of Trustees
      • Staff
      • Volunteers
      • Employment
      • Financials
      • Contact Us
      The statue, La Brezza, on display in the lower gardens at Applewood

      Our Mission

      Our mission is to advocate, stimulate, and support community vitality. Our commitment is to base the Foundation in Flint, Michigan.

  • What We Do
      • What We Do
      • Our North Flint Focus
      • What We Fund
      • Strategic Plan
      • North Flint Community Dashboard
      • How Can We Partner With You in North Flint?
      • Calendar
      • Leadership Award
      Foundation president speaking at a community forum

      Focusing on North Flint

      Our goal is to help north Flint residents create opportunities to contribute and thrive.

  • Apply / Renew
      • Apply / Renew
      • Talk to Us About Your Idea
      • Application Deadlines
      • Grant Guidelines
      • Learning & Evaluation
      • Forms & Templates
      Man flipping through the Foundation guidelines presentation

      Have A Proposal?

      We consider proposals for projects that serve north Flint residents. We encourage you to talk to us about your idea.

  • Grants Search
  • News
      • News
      • News
      • Reports & Publications
      Ruth Mott Community Forum

      What's Happening?

      News about the Ruth Mott Foundation and Applewood Estate.

  • Applewood
  • Search Icon

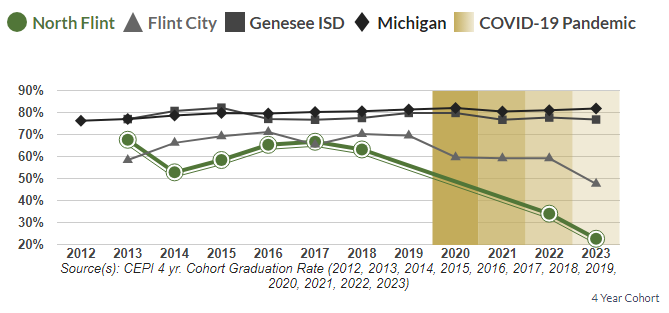
NORTH FLINT DASHBOARD

Positive change
Negative change
"+" Value increased
"-" Value decreased
"=" No change
Data coming soon
Login

=
Main Page

:


Quick Analysis:

Filters:

Filtering By:

  • Geography:
  • Race/Ethnicity:
  • Year:
  • Grade:
  • Age:
  • Educational Attainment:
Clear filters
  • export iconExport
  • share iconShare
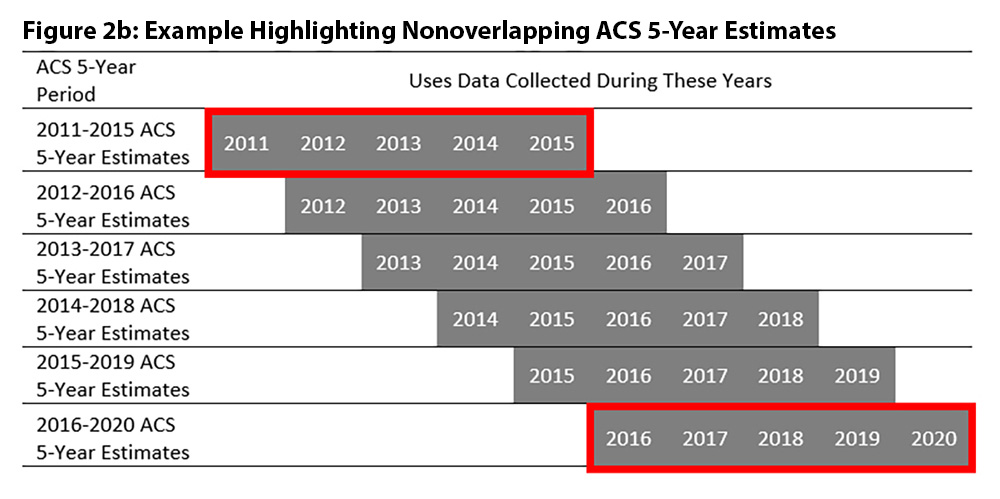
This information is from American Community Survey 5-year estimates. To view data from other five-year periods in the chart below, click on the Year filter button to the left. Click here for more information about this data source.

Hispanic or Latino data is suppressed for ACS 1-year estimates. Please use this link to find 5-year estimates for this demographic.

*Race and Ethnicity is not available from the data source for this indicator.

Hispanic or Latino data is suppressed for ACS 1-year estimates. Please use this link to find 5-year estimates for this demographic.

Name
Value

Hispanic or Latino data is suppressed for ACS 1-year estimates. Please use this link to find 5-year estimates for this demographic.

Johnson Center for Philanthropy logo Powered by the Johnson Center for Philanthropy
©  Grand Valley State University and the Ruth Mott Foundation
Privacy Statement


Error

We're sorry, an unexpected error has occurred. Please contact support with the error code below.

Select Geography

Select Race/Ethnicity

Select Year

Select Grade

Select Educational Attainment

Select Age

No Data Available

We're sorry, no data is available at this time.

No Data Available

We're sorry, no data is available for the selected filter combination.

Select Component to Export

  • Trend Chart
  • Race/Ethnicity Chart
  • Geography Compare Chart
  • Map
  • Data

Share

Copy the link below

URL copied to clipboard!

Warning

We are sorry, maps with education data can only be exported using the Google Chrome browser.

We apologize for the inconvenience. Please use Chrome if you wish to download this map.

We are sorry, this map can only be downloaded using the following browser versions:

  • Google Chrome version 4 or higher
  • Firefox version 52 or higher
  • Internet Explorer version 11 or higher
  • Edge version 12 or higher
  • Safari version 6 or higher

We apologize for the inconvenience. Please use Google Chrome or make sure your browser is up to date to download this map.

About the Data


For more information on this data, please see

Notice

Notice

The COVID-19 pandemic has had an impact on many of the indicators presented on the dashboard. Please note the following new visual cues:

Warning icons and tooltips

When data displayed on the main page or dashboard page may have been impacted by the COVID-19 pandemic, a warning icon and informational tooltip will be displayed next to the year.

Main page

Dashboard page

Trend chart shading

When data dislayed on a trend chart includes years that may have been impacted by the COVID-19 pandemic, these years will include a shaded background and corresponding chart legend entry.

Trend chart

American Community Survey 5-year Estimate Information

The American Community Survey (ACS) is an ongoing survey performed by the U.S. Census Bureau. Data collected through the survey is released annually in 1-, 3-, and 5-year estimates. This dashboard displays data from the ACS 5-year estimates to provide the most reliable information about small geographic areas (e.g., census tracts).

Since data from the ACS 5-year estimates are collected over the course of a 60 month period, the Census Bureau advises against comparing data points from overlapping time periods (e.g., comparing data collected from 2015 through 2019 against data collected from 2016 through 2020). Therefore, this dashboard only shows nonoverlapping ACS 5-year estimates when trending data for comparison. The following image helps to illustrate nonoverlapping time periods:

For more information, please refer to the links below:

  • https://www.census.gov/programs-surveys/acs/about.html
  • https://www.census.gov/programs-surveys/acs/guidance/estimates.html
  • https://www.census.gov/newsroom/blogs/random-samplings/2022/03/period-estimates-american-community-survey.html